# If you are using Google Colab, uncomment the following line to install igraph
# !sudo apt install libcairo2-dev pkg-config python3-dev
# !pip install pycairo cairocffi
# !pip install igraph
Hands-on: Robustness (Random attack)#
We consider a small social network of 34 members in a university karate club, called Zachary’s karate club network.
import igraph
g = igraph.Graph.Famous("Zachary")
igraph.plot(g, vertex_size=20)
Let’s break the network 😈! We will remove nodes one by one and see how the connectivity of the network changes at each step. It is useful to create a copy of the network to keep the original network unchanged.
g_original = g.copy()
Robustness against random failures#
Let us remove a single node from the network. To this end, we need to first identify which nodes are in the network. With igraph, the IDs of the nodes in a graph are accessible through Graph.vs.indices as follows:
print(g.vs.indices)
[0, 1, 2, 3, 4, 5, 6, 7, 8, 9, 10, 11, 12, 13, 14, 15, 16, 17, 18, 19, 20, 21, 22, 23, 24, 25, 26, 27, 28, 29, 30, 31, 32, 33]
We randomly choose a node and remove it from the network by using Graph.delete_vertices.
import numpy as np
node_idx = np.random.choice(g.vs.indices)
g.delete_vertices(node_idx)
print("Node removed:", node_idx)
print("Nodes remaining:", g.vs.indices)
Node removed: 6
Nodes remaining: [0, 1, 2, 3, 4, 5, 6, 7, 8, 9, 10, 11, 12, 13, 14, 15, 16, 17, 18, 19, 20, 21, 22, 23, 24, 25, 26, 27, 28, 29, 30, 31, 32]
Note
np.random.choice(array) takes an array array and returns a single element from the array.
For example, np.random.choice(np.array([1, 2, 3])) returns either 1, 2, or 3 with equal probability.
See the documentation for more details.
The connectivity of the network is the fraction of nodes in the largest connected component of the network after node removal.
We can get the connected components of the network by using Graph.connected_components.
components = g.connected_components()
The sizes of the connected components are accessible via Graph.connected_components.sizes.
components.sizes()
[33]
Thus, the connectivity of the network can be computed by
components = g.connected_components()
connectivity = np.max(components.sizes()) / g_original.vcount()
connectivity
0.9705882352941176
Putting together the above code, let us compute the robustness profile of the network.
import pandas as pd

g = g_original.copy() # restore the network
n_nodes = g.vcount()  # Number of nodes

results = []
for i in range(n_nodes -1):  # Loop if the network has at least one node

    # Remove a randomly selected node
    node_idx = np.random.choice(g.vs.indices)
    g.delete_vertices(node_idx)

    # Evaluate the connectivity
    components = g.connected_components()
    connectivity = np.max(components.sizes()) / g_original.vcount()

    # Save the results
    results.append(
        {
            "connectivity": connectivity,
            "frac_nodes_removed": (i + 1) / n_nodes,
        }
    )

df_robustness_profile = pd.DataFrame(results)
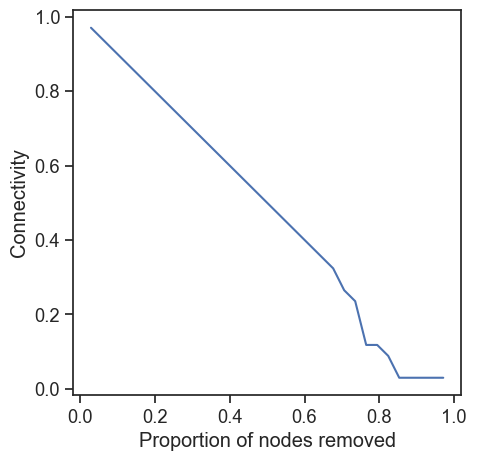
Let us plot the robustness profile.
import matplotlib.pyplot as plt
import seaborn as sns

sns.set(style='white', font_scale=1.2)
sns.set_style('ticks')

ax = df_robustness_profile.plot(
    x="frac_nodes_removed",
    y="connectivity",
    kind="line",
    figsize=(5, 5),
    label="Random attack",
)
plt.xlabel("Proportion of nodes removed")
plt.ylabel("Connectivity")
plt.legend().remove()
plt.show()

Targeted attack#
In a targeted attack, nodes are removed based on specific criteria rather than randomly. One common strategy is to remove nodes from the largest node degree to the smallest, based on the idea that removing nodes with many edges is more likely to disrupt the network connectivity.
The degree of the nodes is accessible via Graph.degree.
print(g_original.degree())
[16, 9, 10, 6, 3, 4, 4, 4, 5, 2, 3, 1, 2, 5, 2, 2, 2, 2, 2, 3, 2, 2, 2, 5, 3, 3, 2, 4, 3, 4, 4, 6, 12, 17]
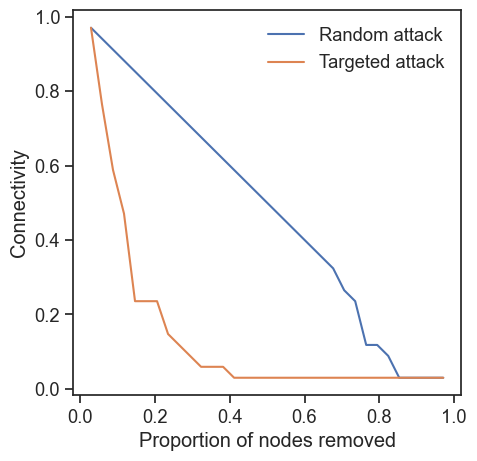
We compute the robustness profile by removing nodes with the largest degree and measuring the connectivity of the network after each removal.
g = g_original.copy() # restore the network
n_nodes = g.vcount()  # Number of nodes

results = []
for i in range(n_nodes -1):  # Loop if the network has at least one node

    # Remove the nodes with thelargest degree
    node_idx = g.vs.indices[np.argmax(g.degree())]
    g.delete_vertices(node_idx)

    # Evaluate the connectivity
    components = g.connected_components()
    connectivity = np.max(components.sizes()) / g_original.vcount()

    # Save the results
    results.append(
        {
            "connectivity": connectivity,
            "frac_nodes_removed": (i + 1) / n_nodes,
        }
    )

df_robustness_profile_targeted = pd.DataFrame(results)
sns.set(style='white', font_scale=1.2)
sns.set_style('ticks')

sns.set(style="white", font_scale=1.2)
sns.set_style("ticks")

ax = df_robustness_profile.plot(
    x="frac_nodes_removed",
    y="connectivity",
    kind="line",
    figsize=(5, 5),
    label="Random attack",
)
ax = df_robustness_profile_targeted.plot(
    x="frac_nodes_removed",
    y="connectivity",
    kind="line",
    label="Targeted attack",
    ax=ax,
)
ax.set_xlabel("Proportion of nodes removed")
ax.set_ylabel("Connectivity")
ax.legend(frameon=False)
plt.show()

While the network is robust against the random attacks, it is vulnerable to the degree-based targeted attack.

